Most traders obsess over indicators.
Professionals obsess over structure.
Market structure is the language of price.
If you can read it, you know:
- who is in control,
- where the market is heading,
- when a trend is weakening,
- and when a reversal is forming.
Everything else builds on this.
1. The Foundation: Trends Are Built From Swings
Price moves in swings — not straight lines.
Understanding these swings is the beginning of real chart reading.
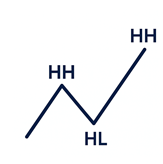
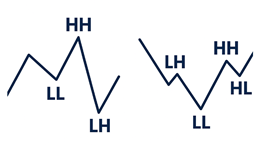
Uptrend Structure
An uptrend forms when price makes:
- Higher High (HH)
- Higher Low (HL)
- then another Higher High (HH)
This means buyers control the market.
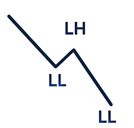
Downtrend Structure
A downtrend forms when price makes:
- Lower Low (LL)
- Lower High (LH)
- then another Lower Low (LL)
This means sellers control the market.
Why This Matters
Once you learn to see swing highs and lows, everything becomes easier:
- knowing trend direction
- spotting pullbacks
- recognizing trend reversals
- avoiding counter-trend traps
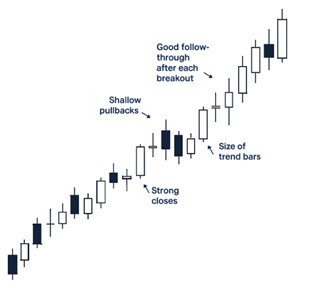
2. Trend Strength: It’s Not the Angle — It’s the Follow-Through
Most beginners think a steep trend = strong trend.
Wrong.
Professionals measure strength by:
- Size of trend bars
- Shallow pullbacks
- Good follow-through after each breakout
- Strong closes
If the swing legs become smaller or pullbacks deepen, the trend is weakening.
3. Channels Reveal the TRUE Path of a Trend
Every trend develops a channel — even if it's not perfect.
Bull Trend Channel
- Higher highs pushing the upper channel line
- Higher lows respecting the lower channel line
Bear Trend Channel
- Lower lows tagging the lower channel line
- Lower highs respecting the upper line
What Channels Tell You
- A tight channel = strong trend
- A wide channel = mature trend
- A channel break = first sign of reversal

4. When Structure Breaks — The Market Flips
A trend does NOT reverse until it breaks structure.
For an uptrend to reverse down:
- It must break below the last HL → forms a LL
- Then fail on the retest → forms a LH
For a downtrend to reverse up:
- It must break above the last LH → forms a HH
- Then hold the retest → forms a HL
This is the cleanest and most reliable reversal logic in price action.
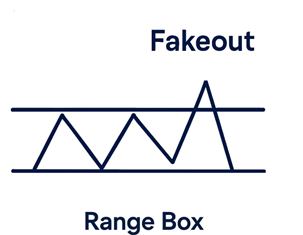
5. Ranges — Where Most Traders Lose Money
A range is a market with:
equal highs
- equal lows
- no clear direction
Ranges produce:
- fake breakouts
- failed patterns
- choppy movement
How Professionals Trade Ranges
- Buy low, sell high ONLY with confirmation
- Stay away from the middle
- Expect fakeouts above and below the range
Weak traders get chopped up
Because they try to trend-trade a market that isn’t trending.
Don’t do that.
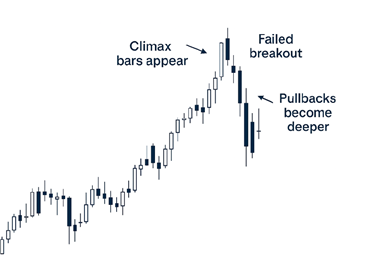
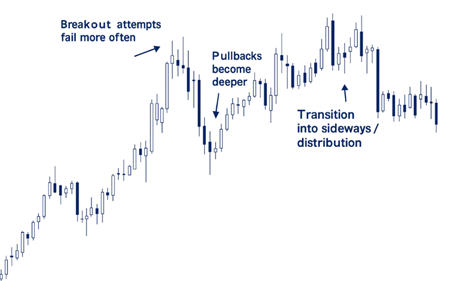
6. Trend Exhaustion: The Market Is Preparing to Reverse
A trend rarely reverses out of nowhere.
It leaves clues:
Signs of exhaustion:
- Pullbacks become deeper
- Trend bars shrink
- Dojis start appearing
- Climax bars appear
- Failed breakouts
- Break of a channel line
When you see these signs stacking together — preparation is more important than prediction.